As I continue with the development of Front Office Football 8/2016, I’m taking a long look at the effect of weather in the NFL. The preliminary piece of this study is a limited look at points scored in various conditions. Later, I’ll get into how statistical results are affected, particularly in the passing game.
It’s important to note that any results are a combination of two very different mechanisms. First, the physical effect associated with the weather condition. If wind, for example, makes it more difficult to throw an accurate long pass, then you’ll see lower completion rates and more interceptions. And second, there’s the effect of changing strategies. Wind may make quarterbacks attempt fewer long passes. Completion percentages may rise. Even completion percentages for long passes might not change, because quarterbacks might be less likely to challenge a cornerback holding a decent coverage position.
Any conclusions will be a factor of many different statistical observations. What I noted about wind games (a definite trend linking lower scores to higher wind speeds) may have quite complex reasoning requiring many different individual studies. Maybe wind-battered passes are just as effective, but teams run a tiny bit more, leading to fewer clock-killing incompletions and less plays per game. I haven’t looked at that yet – it’s just one hypothesis among many.
I’ll conclude this with a brief look at temperature and points scored. What I see is very raw, but the only trend line I see is that when it’s very cold, there’s more scoring. So cold weather may affect the defense more than the offense. Again, this is not a scientific conclusion.
Looking at the numbers… I chose an “effective temperature” for each game from 2010-2015. This temperature is the temperature recorded by the NFL for each game. For temperatures 80 and above, I added the relative humidity and calculated a heat index (this is a surprisingly complex formula, involving nine different coefficients related to heat and humidity). For temperatures 50 and below, I added the wind-chill factor.
I studied 1,210 outdoor games. These included all regular-season and playoff games from 2010-2015, minus those played in domes and those in stadiums with retractable roofs with the roof closed.
The average points scored in these games was 22.5 per game per team (indoor scoring is 23.4 points per game per team – something that could be affected by the fact that the teams involved in dome games are hardly an independent sampling of the NFL).
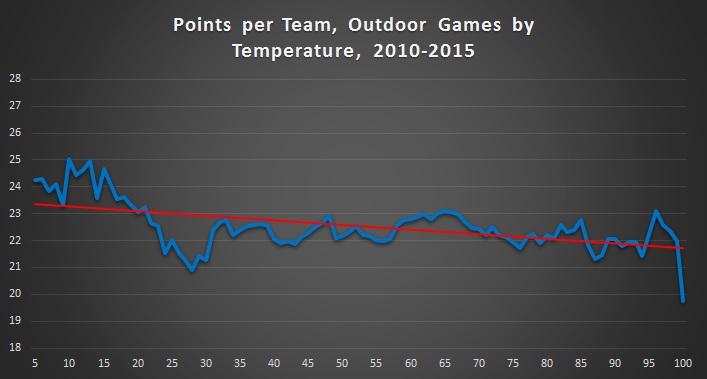
I calculated the data points on this chart based on a nine-degree average surrounding a data point. The points on the “end” include everything less or more than that temperature as well.
So it makes sense that there’s more variety on the ends. From 5-10 degrees, about 20 games were included in each average. That increases to about 50 games until the temperature reached 30 degrees, then it quickly rises to about 100. At its peak, between 52 and 75 degrees, more than 200 games comprise each average. Around 85 degrees, it’s back to about 50 games, and it drops to around 10 in the high 90s.
I then re-ran the same chart, without playoff games included. I did this because playoff games are generally played in colder weather, and generally include better teams. There’s a definite bias in including playoff games in a temperature study.
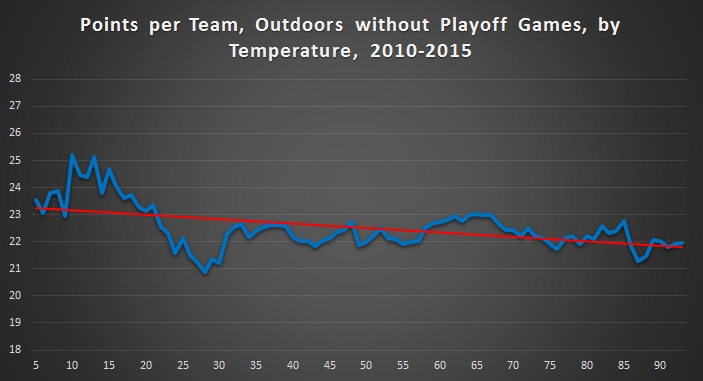
The same trend line emerges, but the extreme left edge, which had included a handful of high-scoring extremely cold games, moves much closer to the line. So the premise that cold weather helps the offense or hurts the defense is intact.
Next, I separated out games played on grass. The average points per game per team is 22.0.
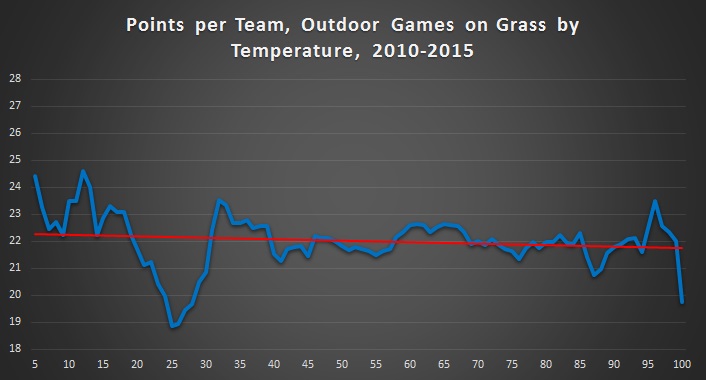
This flattens out the trend as temperatures rise above 40, but in cold games, there’s a huge dip in the 20s. Why? There just aren’t that many cold weather games on grass. Teams that play in stadiums where it can get that cold usually have artificial turf. Of the seven teams that play where the average game temperature is below 50, four are on turf. And Green Bay, which has a huge share of the truly miserable temperature games, is also on turf. So there isn’t much of a sample of grass games in the 20s – a grand total of 60 of the 764 grass games included were played when the wind chill was 32 or below. I can’t attach significance to that dip.
I also wanted to separate turf games because of the turf heating effect I discussed the other day. Artificial turf retains more heat than asphalt or sand, even. Here’s the turf chart. The average points per game per team is 23.2 – 1.2 points higher than on grass. Only 13 games in the entire survey were played with a temperature above 78 on turf – hot-weather teams do not have turf fields outdoors. The retractable roof teams always close the roof when it’s over 80 outside during the daytime.
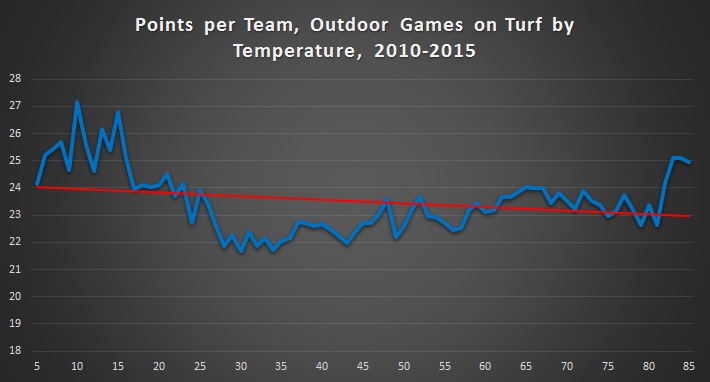
There’s more variation in this chart than the grass chart. That could be because there are fewer outdoor turf teams. There’s also a subtle suggestion that heat means higher scores, but there’s just not enough data to call that significant.
Finally, just for illustration, the average temperature of games at each home stadium during the survey.
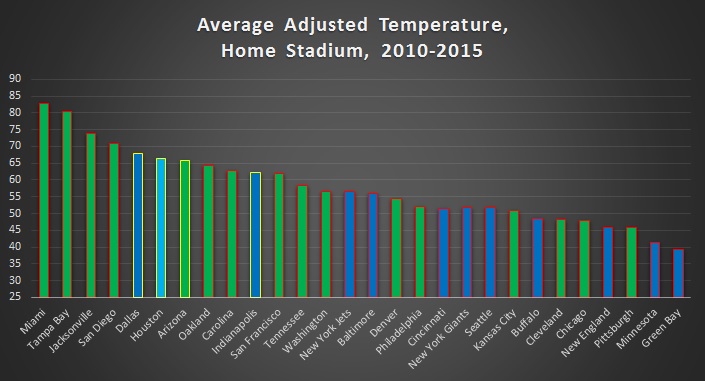
Where the bars are green, stadiums use natural grass. Where the bars are blue, they use turf. Light blue is for Houston, which replaced their grass with turf early this season. A yellow outline indicates a retractable roof, and temperatures were only calculated for when the roof was open.
There’s a lot of criticism out there when it comes to Pittsburgh and their grass field. Dan Rooney, the Steelers’ owner, feels it’s important to have high-school championship games at Heinz Field, as well as University of Pittsburgh games. For a long time, they used what’s called Grassmaster – grown grass infused with artificial fibers. It works well in Green Bay, where the field is never used except in Packers games. But with at least twice the use, Grassmaster is torn up. Resodding is impossible mid-season with Grassmaster. So the Steelers gave up on it and now resod their grass field a couple of times per year, because grass won’t grow in a Pittsburgh fall/winter. It’s often a mess (though never as bad as it was the time they tried to put sod over the Grassmaster, and the result was that 3-0 Monday Night game when a punt actually stuck in the sod upon landing). Rooney feels grass is safer (players agree) and the problems associated with having the coldest games on natural grass and a grass field consistently rated the worst in the NFL are better than going to FieldTurf. He may be right.
I may move Green Bay’s field over to the grass side for the purposes of this study. Grassmaster should behave more like grass when it comes to heat – the fibers are mostly under the surface and intended to strengthen the root system. I should consider this change for consistency as well. Denver used Grassmaster until this year, but always reported a grass surface in game books.