A big part of moving the FOF8/2016 release to next year means a more thorough refinement of the game engine. This means I can spend some more energy right now on my favorite pastime: playing with spreadsheets.
Lately, I’ve been taking a look at the weather. I’ve compiled weather data for the last six seasons. When 2015 is over, I plan to update my quarterback study not only with data about mobile quarterbacks (I want to find out why Cam Newton wins so much despite thoroughly mediocre passing numbers), but with some weather information as well.
That work won’t take place until after the Super Bowl. I like to include playoff data, though it is biased not only by the exclusion of poor-to-middling teams, but by much colder weather as well.
In the meantime, I thought I’d share some simple data about the weather, starting with some bluster.
The period of study here is 2010-2015. That’s 1,575 games through last Sunday. The average team scores 22.7 points per game. Now this could be biased by which teams play where, but on turf, the average is 23.4 points per game, and on grass, it’s 22.1 points.
Indoors (or in a retractable roof stadium with the roof closed), the average is 23.4 points. Outdoors, it’s 22.5 points. Breaking down games played outdoors, the average on turf is 23.2 points and the average on grass is 22.1 points.
Can we conclude that artificial turf helps the offense? I don’t know. I’d probably start that study by comparing the average number of wins by teams playing at home on turf with that of teams playing on grass. Since the nine outdoor turf teams include New England, Green Bay, Baltimore, the Giants and Seattle – the last five Super Bowl winners – I think I know where that would go: into the bit-bucket of small and non-independent sample sizes.
So, what do I have here? Wind speed isn’t exactly independent, either. First, each stadium, which means specific teams, experiences different wind conditions. But at least I’ve accumulated a lot of different data points from each team, ranging from 17 Minnesota games (they moved out of the Metrodome in late 2013) to 56 New England games (win that much and you get to play a lot of post-season games at home). I have wind data on 1,199 games.
However, it’s hardly exact data. Each team has a stringer who reports weather data to the NFL as part of the game book. While I’m sure there are instructions, they may be carried out differently. Given the use of round numbers and the fact that a lion’s share of the top wind games are reported in Cleveland, I suspect the person reporting on Browns’ games may like to exaggerate. I see other little quirks here and there. Enough that I think having about 50 data points on each stadium helps, but is hardly enough to make conclusive statements.
The first chart isn’t ground-breaking, but it does allow me to strongly suspect that wind helps the defense.
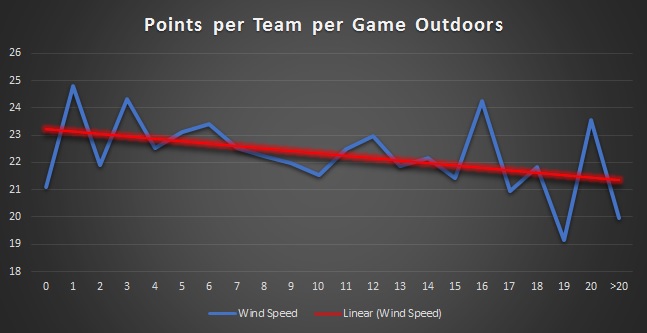
There’s a slight downward trend here. Breaking the trend line in the middle, points per game per team is 22.0 when the wind is measured from 0-8 mph and 22.9 when the wind is measured at 9 or more mph. The average reported wind speed is 8.6 mph.
Moreover, in the 25 games when wind speed was reported at more than 20 mph, average points per game was 20.0. However, seven of those 25 games were in Cleveland. On the other hand, the Browns averaged 23.6 points in those seven games (now we’re really looking at tiny samples).
My further study will hopefully add some insight as to why offense seems lower in higher winds, but for now, I can’t say why this is the case. My operating guess is that teams throw long less frequently. If that’s true, completion percentage may actually rise in windy games, but yards per catch will be greatly decreased.
Just for fun, here’s the average reported wind speed at each team’s home games over this time period:
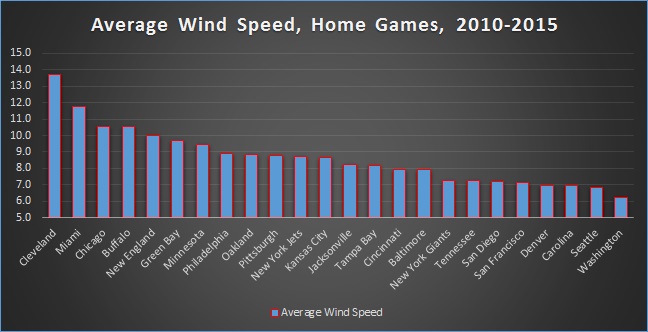
Average wind speed in major American cities ranges from about 6-12 mph. Boston is probably the windiest major city, Phoenix probably the least. Cleveland is above average, at 10.5 mph. So I was surprised by some of these results. Miami is only a little above average (9.2 mph), so maybe Sun Life Stadium is situated in a windy area (or, again, the stringer there measures a little bit differently than other stringers). San Francisco (10.6 mph) is above average, but Levi’s Stadium, which is actually just north of San Jose, is near the bottom of this list. I doubt that would have been the case with Candlestick. San Jose reports an average wind speed just below 7 mph.
Of course, different stadium alignments or the way the stands are arranged could have a dramatic effect on wind. I’m not sure whether to include data from the retractable roof stadiums. The walls are more expansive and the retractable area is confined. Also, roofs are usually closed. Together, the four teams with retractable roofs had them open a grand total of 50 times during the study period. Dallas reported average wind speeds of 10.6 mph, Indianapolis 8.2, Houston 7.2 and Arizona 5.0 with the roof open.
As for scoring, in the 50 games in retractable roof stadiums with the roof open, teams have averaged 24.0 points. In the 144 games when the roof was closed, the average was 22.6. Indianapolis and Dallas have artificial turf, Arizona has grass and Houston had grass for the first 26 games in this study and has used turf in the last six games. There’s not enough data to conclude that roof status affects scoring.
I’ll present some data about temperature in my next entry, perhaps tomorrow.