I often enjoy all the spreadsheets I’ve created while working on Front Office Football. Many of these spreadsheets track incidental elements. For example, I ran a lot of numbers a couple of years ago to analyze at what point owners fired their coaches. That’s helped produce a more accurate AI in terms of coaching turnover.
But most of the big spreadsheets relate to the game engine. If Front Office Football’s simulation engine doesn’t produce statistics that feel like an NFL product, people aren’t going to lose themselves in the game.
This is made considerably more difficult by the fact that this is a career-play simulation rather than a replay simulation. That might seem like a subtle distinction, but these concepts are worlds apart.
The goal of a replay simulation is to take a target season and produce exactly those statistics. If you run the 2014 season, for example, DeMarco Murray will lead the NFL with about 392 carries and about 1,845 yards. Dallas will be modeled to give him that workload. Player ratings will be exact. Play ranges will be carefully tailored to 2014 results. The standings should be extremely close to last season’s actual standings.
A career-play simulation is very different. When thinking about this difference back when I started work on the game, I came up with what I call the “X-Factor,” which is the idea that I want to create a fictional world very similar to the current NFL. I want the game to work pretty much the same whether you use “real” players or generated players. I want you to be able to play 100 seasons in a universe and see a wide range of results – all within the realm of realistic based on today’s structure.
To get there, I shouldn’t model players exactly. DeMarco Murray will usually be a great runner, but sometimes he’ll only be a good one. Dallas will usually be one of the best running teams, at least when you start out, but that will depend on personnel. And over time, that will change, and Dallas will create game plans tailored to its strengths and weaknesses.
The X-Factor, if implemented correctly, should maximize the replay value of a career-play simulation.
Of course, the NFL is constantly changing. And I want to produce a simulation that has as much validity as possible in the current NFL universe. So I try and check the engine every year (this last update is the exception, since I’m working on a new development tree and any tweaks would have to be duplicated). It’s an ongoing process.
This first image is somewhat central to the NFL’s “engine” – in that it reflects the fundamental relationship between each play and the final score of the game. It’s how many points a team can expect to score per play on offense.
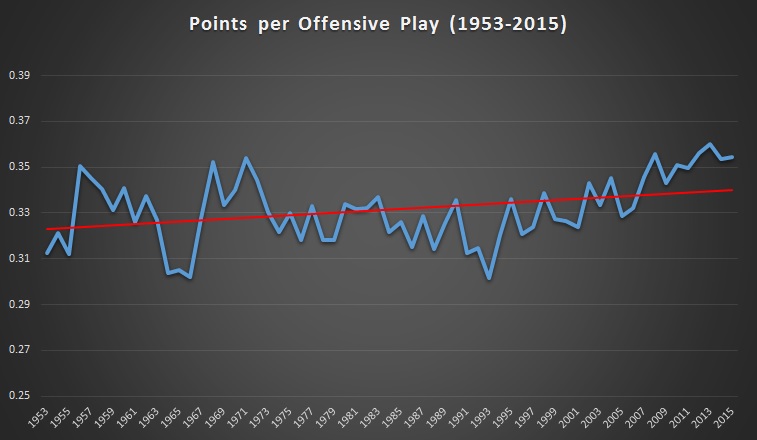
As long as this chart remains relatively flat, the NFL will feel like the NFL, year after year. And, by and large, it does. But there are some exceptions, and, as you can see, it’s a bit difficult to get a true feel for the numbers with all the up-and-down in the model.
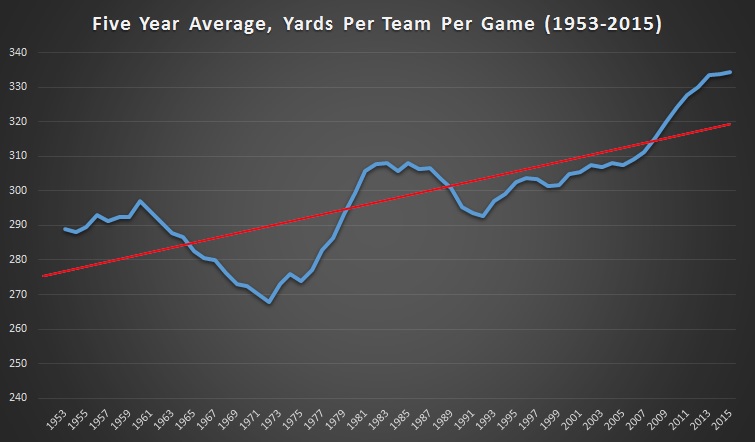
So, once I had been doing this a while, I decided it was better to look at the NFL using five-year averages (tapered on the ends – the last two data points are an average of the last four years and the last three years). This “smooths” the above chart like this:
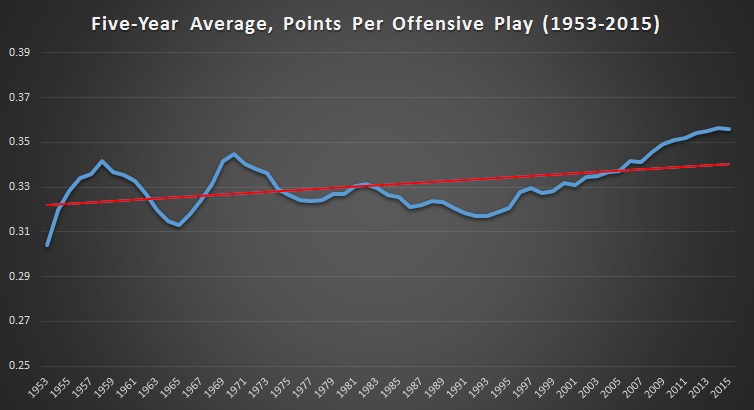
This is a lot easier to analyze. We see a general trend line of increased offense (the red line in all these charts is a linear function fitted to the entire data set). And we see general points where these trends changed slightly.
The difference between these two charts, I hope, explains exactly why I use five-year averages. There are only 32 teams in the NFL. How coaches call plays, defend against plays and use personnel varies considerably. And 32 is small enough a group that it is very sensitive to “small sample size” issues. The more you expand that group, the more exact your analysis. However, if you expand it too much, you lose the ability to see trend lines. After years of looking at this type of chart, I’ve found five-year periods to be the most meaningful.
So, where do I “center” a simulation? That’s a difficult question. In most cases, I aim at the average of the last five seasons. The reason I do this is because of the variability built into the engine. If my goal were simply to simulate the last season, I might be hitting one of those little jagged peaks or valleys in the curve. And with flexible performances, the simulation would produce values above and below that peak. Over time, the record performances in this league would be remarkably unrealistic.
If you’re not careful with your centering, you’ll end up with more extreme peaks than is realistic. This is why replay simulations have to be much less flexible with their results.
In Front Office Football, if you look at a 100-year career, you’ll notice significant statistical variability. Just taking a quick look at the last 120-year simulation I ran when testing for the 2014 update, yardage per pass attempt for a full season varied from about 6.5 to 7.5 over some very short periods. This with the same engine and game plans constructed with the same algorithms. This is OK, because the results still feel like a realistic engine as they provide the variability necessary to immerse you in long careers.
But, what should I do when the trend line shows that today’s performances are the highest ever, as most statistics focused on passing express (you’ll see many examples in this article)? Often, what goes up comes down in the NFL, but that’s not always the case. So what I do in these cases is set the goal at the average of the last three seasons.
In the case of points per offensive play, this approach actually increases the goal by a fractional amount (well below any margin I could measure in testing) – from the 2015 figure of .355 points per play to the 2013-15 average of .356.
Here’s a better example of the five-year concept:
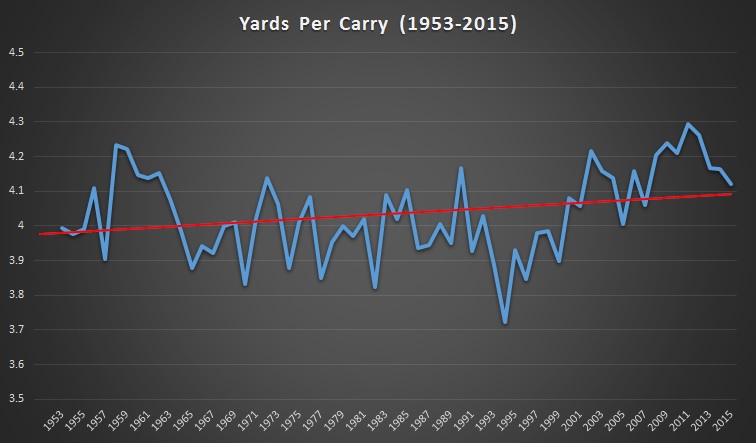
This is yards per carry in the NFL, which has a more consistent long-term trend line, but jumps up and down quite a bit. Most notably, the average was 3.72 in 1994 and 4.29 in 2011. Either value would produce considerably unrealistic long-term numbers if that’s where the simulation were centered.
Here’s the same chart using five-year averages:
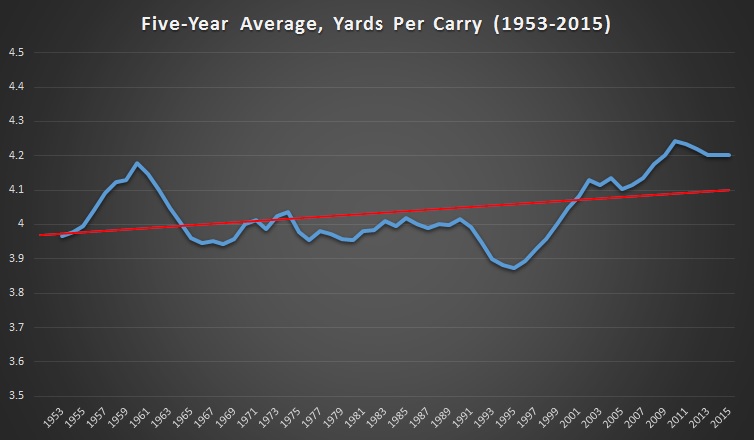
With this chart, the 1994 value is 3.88 (1995 is 3.87) and 2011 is 4.23 (2010 is 4.24). This may seem like an insignificant difference, but I think it makes a world of difference – especially when I’m tweaking the engine almost every year.
That’s the first major topic I wanted to cover in this article. The second is discussing, essentially, how the NFL works. Well, nothing that expansive. More how NFL numbers work.
I’ve talked about this before – mostly in the context of what professional football is. The basic modern relationship between running and passing at variable distances starts in 1978. I’ve extended these charts back to 1953, though, to provide a little history and to show that these relationships do go back a long time.
I have a hard time making much sense of numbers before 1951. The NFL rules set was under constant change in the ’40s – free substitution wasn’t always allowed, the hashmarks moved. Most importantly, in 1951, the NFL went to the current model of banning linemen from catching passes. I’ve found the numbers from 1951 and 1952, while this change was digested, more inconsistent with surrounding years than anything else in history. So the beginnings of these curves are a little too variable.
Since 1953, there’s been less change. In 1956, the NFL implemented the modern concept that a player is “down” when part of his body other than the hands or feet hits the ground (it was changed from in the grasp to contact a few years later). In the ’60s, the AFL formed and then merged with the NFL. And during that time, defenses became more sophisticated and more brutal. Defenses started to dominate.
In 1974, right as the Steel Curtain was the embodiment of the NFL, the modern game emerged. Over the next five years, the NFL changed the rules related to receiver contact and blocking. The schedule expanded from 14 to 16 games. As many of these charts show, it took a couple of years to adjust, but the game became much more consistent by about 1980.
The NFL has been reluctant to make significant adjustments since 1978. But defenses started improving in the late ’80s and early ’90s, mostly in making life more difficult for quarterbacks and receivers. So in 1994, the receiver contact rule was redefined and rules about hitting the quarterback were changed. The receiver rule was further enforced in 1996. Since then, offense has increased, particularly in the passing game.
All these rules opening up the passing game have had an effect. And even when the rules aren’t changing, coaches are always innovating. When an innovation works, everyone follows, sooner or later. Sometimes these innovations fail when defenses adjust. Sometimes they somewhat fail, but evolve into something much more effective – like the way the Wildcat concept is somewhat related to today’s option run/pass reads out of the shotgun.
The following charts show some statistics where we’ve seen the most change over the years.
First, teams are passing more frequently:
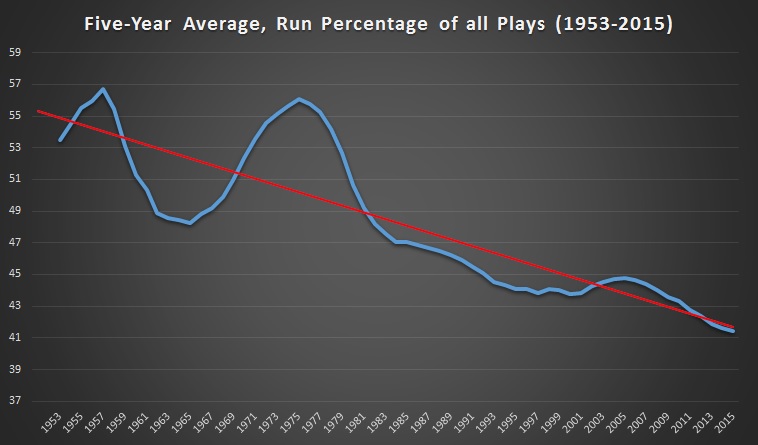
This chart shows the dramatic effect of the rules changes in the late ’70s. And also, that the NFL probably wants more passing. Even though scoring wasn’t down and passing numbers were still very high, the NFL made a “point of emphasis” about the illegal contact rule in 2004 – ostensibly in response to the Patriot teams that were having success impeding receivers in the early ’00s. Today, teams are running only about 40-41% of the time. That’s a huge difference even from when I started working on Front Office Football. In 1998, teams ran about 44% of the time.
The next three charts show the impact of what we called the “West Coast Offense” at first, which was a specific set of plays designed by Bill Walsh, but came to mean any offense that utilized shorter slants and multiple outlets, maximizing yards after catch.
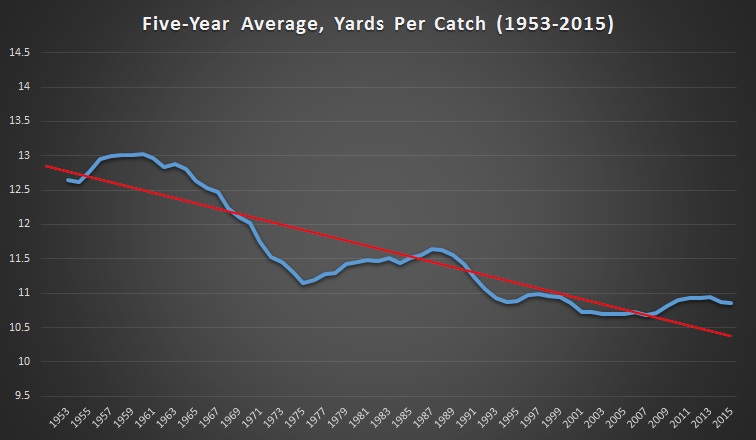
Note that yards per catch has remained relatively consistent since the chucking rules were updated in 1994. But other related statistics show more change.
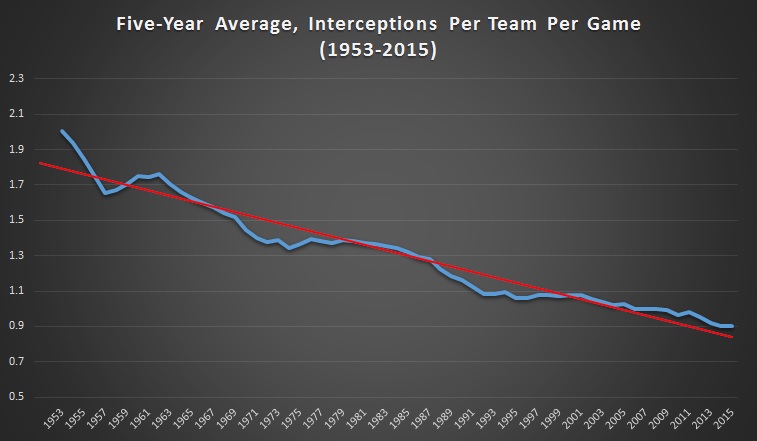
Even though teams are throwing a lot more, and defenses have adapted by making nickel defenses pretty much the standard personnel set, interceptions are on the decline. Part of this is the West Coast concept, and part is that demands on quarterbacks continue to increase. Turnovers cause a lot of harm.
You’d think the decrease in interceptions might mean quarterbacks throw the ball away more often. But that’s not the case.
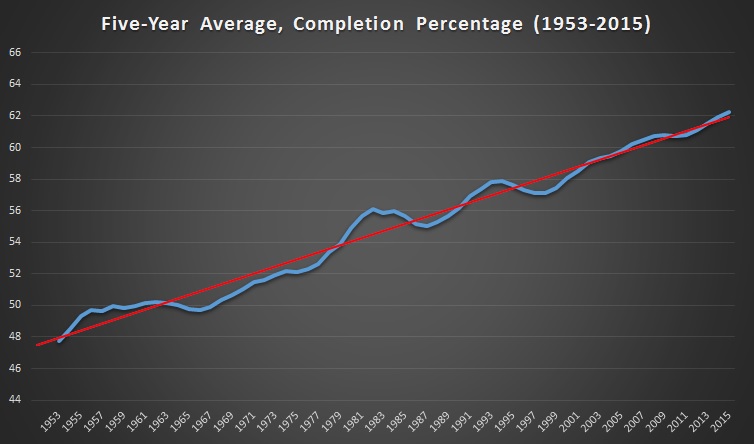
As interceptions have declined, completions have increased. Quarterbacks are a lot more accurate than in the past. Before 1994, this could be attributed to attempting less risky passes. But, again, yards per catch is relatively constant the last 20 years. Going back to when I started this in 1998, completion percentage was 57%. Today, it’s touching 62%. This with more passing than ever before.
Have quarterbacks become too good at what they do? Or is offensive game-planning further ahead of defensive game-planning than at any time in the past?
Total offense and scoring were relatively consistent for a long time after the Steel Curtain changes. However, in the last 8-10 years, offense is climbing fairly steadily at a rate we haven’t seen since the late ’70s.
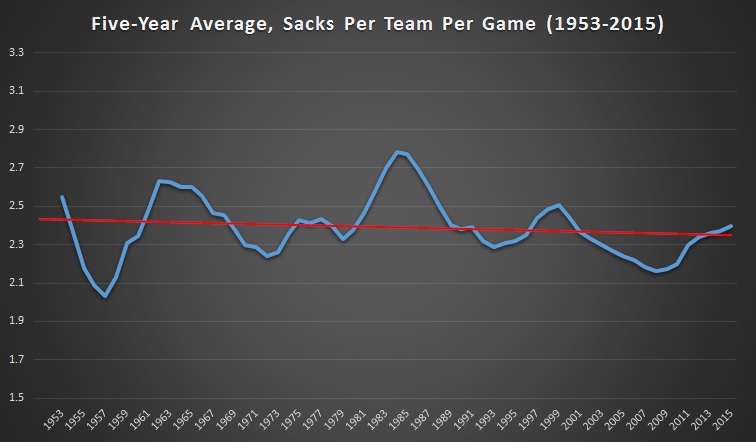
It’s nothing you see in the running game. That’s increased a little, but not all that much when you think of how much less teams are running these days. Sack percentages haven’t changed much over the years. Defensive players are better at beating linemen, but quarterbacks get the ball out faster.
However, passing is much more effective:
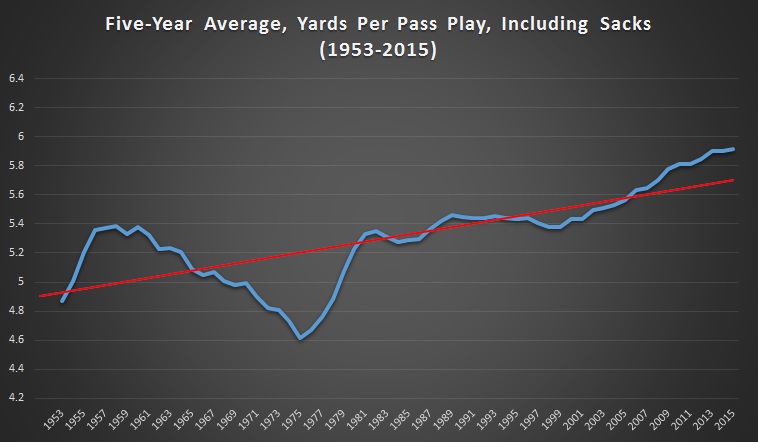
The increases over the last 8-10 years are perhaps most evident here. It doesn’t look as dramatic as some of the other charts, but the jump in the five-year average from 5.5 to 5.9 yards per play, combined with the increased completion percentage, means it’s a lot easier to keep the chains moving with your passing game.
Because of this, passing records will fall on a more regular basis. And maybe they’ll lose some meaning. I’m not sure this is good for the NFL.
In the past, the NFL has reacted more to defensive success than to offensive success. The philosophy is that people love the passing game, and fans get frustrated when receivers are mugged. But I think scoring has increased in the last five years to a point where the game is starting to feel a little different.
What would I do if I were running the rules committee? Probably two things. First, I would get rid of those new gloves that act like stickum without being sticky. I don’t think that adds up to a huge number of catches, but some of the catches we’re seeing seem like they belong more in an action movie than the NFL. And second, I would make a “point of emphasis” on blocking before a receiver catches the ball. Some of the pick plays and wide receiver screens we’re seeing today are almost impossible to defend.
Would these changes revert offenses to where they were ten years ago, or are quarterbacks just too good these days and increased offense is inevitable?